Open healthcare data hack (London 13-14 December 2014)
Team: P Reich, K Hoonio, T Nhung, D Jones (all code and data)
Investigated financial issues relating to UK prescription data (for Aug 2013 to July 2014).
Started by looking at two sources of financial information:
company returns filed with Companies house on the, e.g., medical practices are partnerships or limited and have to file financial data. It was not always possible to obtain data based on the practice name listed in the dataset from OpenCorporates or Company Check and so we did not continue with this approach.
prices of houses sold. Decided that this might not provide a good indicator of personal income.
The 2011 census (raw data) gives average household income within a MSOA (middle layer super output layers; used to aid the reporting of small area statistics, an area containing 5,000 to 15,000 people).
The prescription data included the postcode of the practice where it was written. This was used to map practices to MSOAs using government postcode data.
Per capita income, the mean income per person within an economic unit.
The following Google map shows spending on prescriptions per capita for each MSOA. Looking at a few of the areas suggested a connection between prescription costs and income; what form does this connection take and does it hold in general?
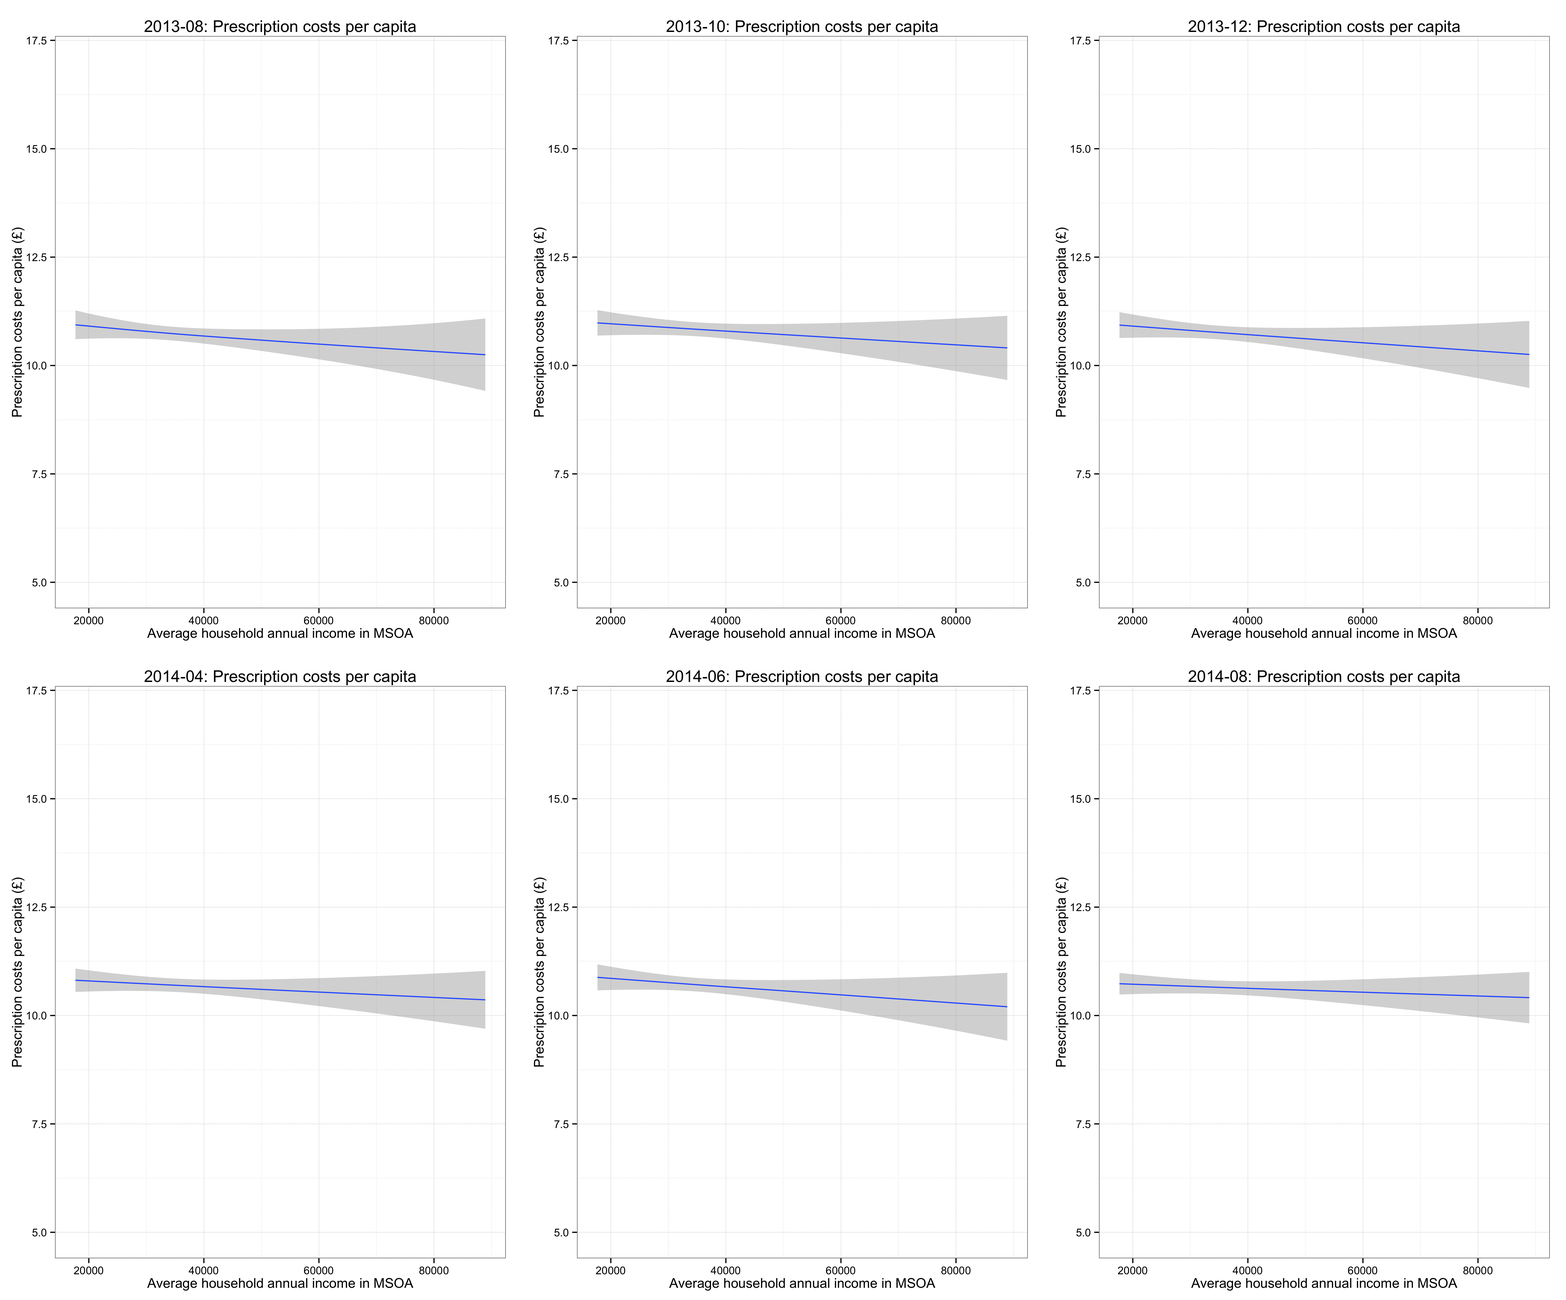
Prescription costs per capita against household income, over all MSOA.

The above plot shows that as household income increases the expenditure on prescriptions decreases (a plot based on number of prescriptions follows the same pattern).
We are assuming that individuals obtaining a prescription from a particular practice live within the same MSOA as the practice.
'Winners' appear to have fewer health issues (measured by prescriptions) and have greater income.